能源图表.info
5.0 颗星,最多 5 颗星(基于 1 条评论)


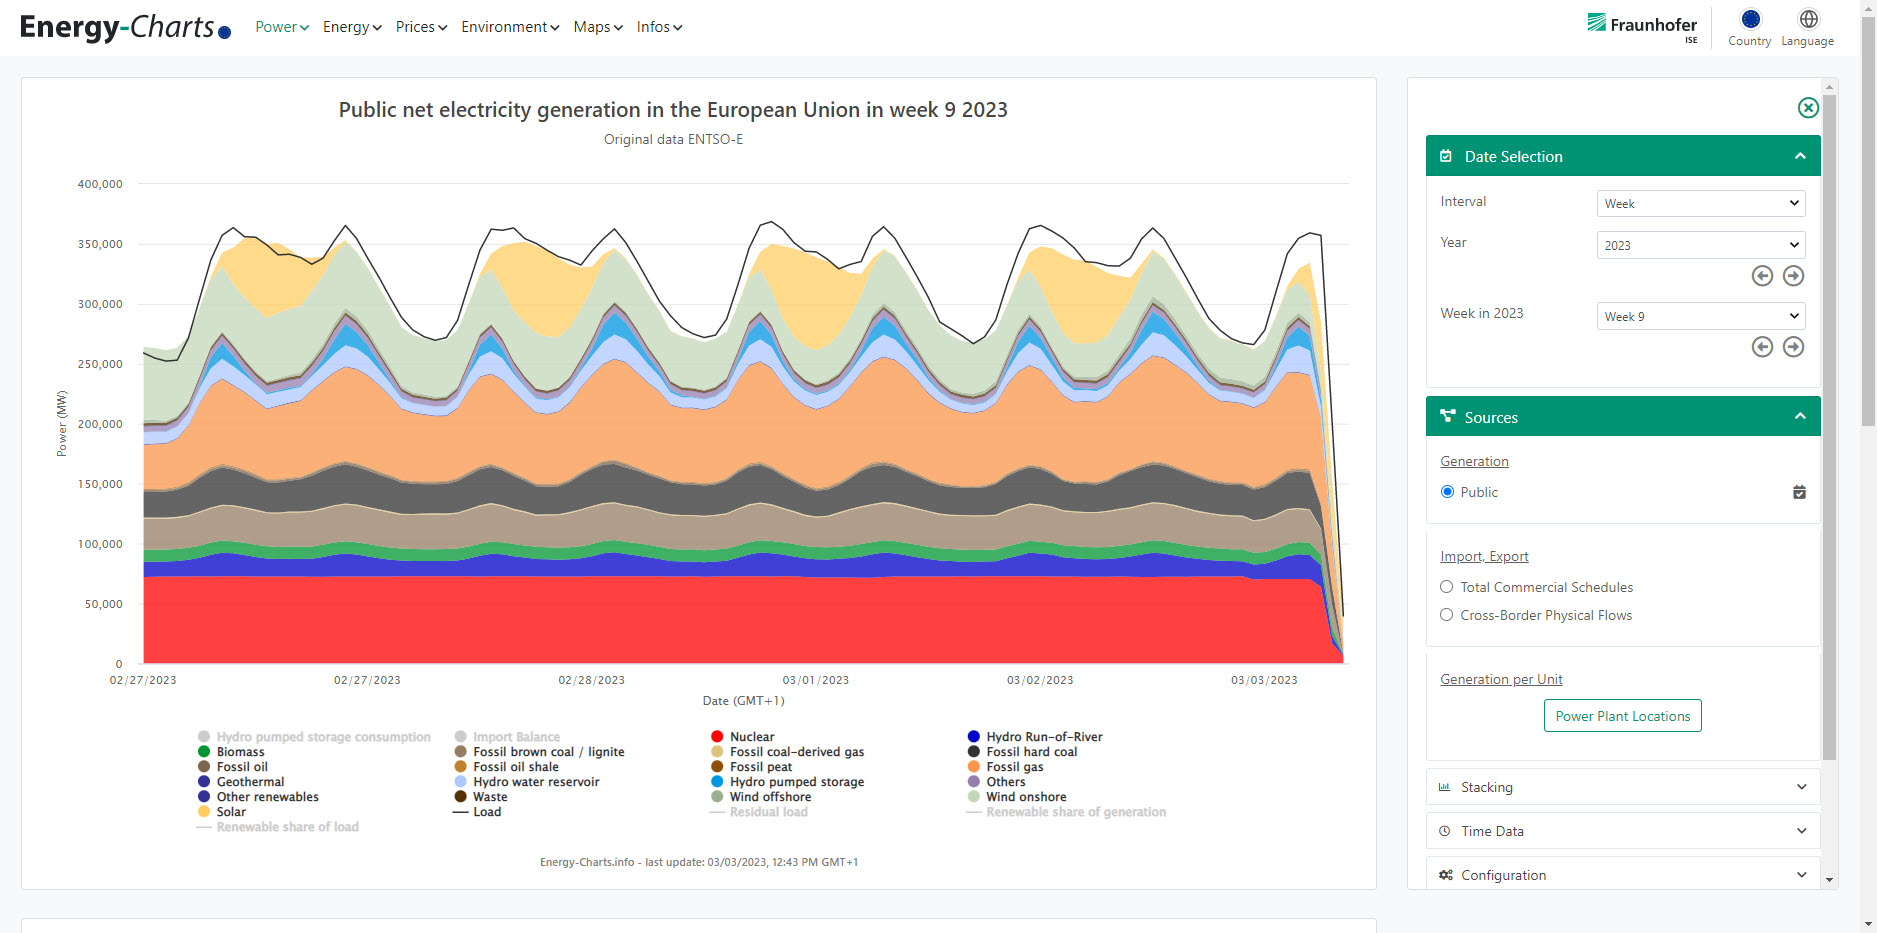
The site for interactive graphics displaying energy production and spot market prices By making the data available on this website, it is our intent to promote transparent and objective discussions relating to all factors regarding the energy transformation.
There seems to be no advertising and data is collected from stats.ise.fraunhofer.de. These are probably for not-for-profit purposes and are processed according to GDPR principles. More info can be found in the privacy policy: https://www.energy-charts.info/data-protection.html?l=en&c=EU